Introduction to Micro-Optimization
A modern CPU is an incredible machine. It can execute many instructions at the same time, it can re-order instructions to ensure that memory accesses and dependency chains don't impact performance too much, it contains hundreds of registers, and it has huge areas of silicon devoted to predicting which branches your code will take. However, if you have a tight loop and you are interested in optimizing the hell out of it, the same mechanisms that make your code run fast can make your job very difficult. They add a lot of complexity that can make it hard to figure out how to optimize a function, and they can also create local optima that trap you into a less efficient solution.
There are going to be very few times in your career when you actually have to pull the last few drops of throughput out of a function. However, there are going to be many more times when you have a performance-sensitive function to implement. The only difference between producing a heavily-optimized function and a good function for a performance-sensitive environment is one of degree: the same principles apply to both. If we can understand how to get peak performance out of a computer, it is a lot easier to write code that merely has good performance.
Over the last several years of my career, I have learned a lot about how to work with this machine to pull out the last drops of performance that it can offer, and applied these techniques on systems that require nanosecond-level latencies and terabit per second throughput. This guide is an attempt to record and systematize the thought process I have used for micro-optimization, and the insights it allows you to apply to everyday computer performance.
What is Micro-Optimization?
There are two definitions I have run across for micro-optimization, and they are very different. The first and most common definition is "optimization at the assembly level." This is the definition I use. The other definition is "optimization underneath the level of a function." I usually just call this "optimization."
Micro-optimization is the last step of any performance optimization process. After you micro-optimize a piece of code, there is no performance left to gain from further optimizations, except re-specializing your code for a new architecture. By design, micro-optimized code tends to overfit to specific aspects of the environment in which your code runs. In some cases, that can be as specific as a single CPU model, but it is usually a CPU family, or a class of CPUs with a given characteristic (eg CPUs with the AVX-512 instruction set).
Micro-optimization applies specifically to code, but it does not apply specifically to CPUs. You can also micro-optimize GPU code, although the tools available to do so are not as good. Most of what I am about to put in this guide applies to CPUs, but GPUs follow the same principles: with an understanding of the architecture and enough visibility into how it executes your code, you can make it sing.
Micro-Optimization and Assembly Language
By definition, micro-optimization involves interacting with assembly language, but today it rarely involves writing assembly. You do not need to know how to write assembly to micro-optimize code: it can be done in any compiled language. However, you do need to know how to read assembly, you need to know your language well, and you need to know your compiler reasonably well. You can even micro-optimize Java or Javascript code if you know the interpreter well, too.
Also, if you are working on a team with other engineers, most of them would prefer that you avoid writing too much assembly. Assembly language is very hard to read, and it is very hard to edit, so if you can keep micro-optimized functions in higher-level languages, such as C++, Rust, or Go, your teammates will thank you.
When to Micro-Optimize
Whenever you talk about optimization, people pull out the quote "premature optimization is the root of all evil." That is probably correct, but optimization becomes worthwhile a lot earlier than many people think. When you are planning an optimization project, it is important to make sure that you can justify the cost, based on the gain that you expect. Improving the speed of a program or a server can mean many things and help in many ways, so if you have a good reason to believe that you should optimize, quantitative arguments often work to show that speed is a feature.
Also, look out for times when optimization can save you engineering effort. If you are thinking about horizontal scaling, but you know that optimizing an inner loop can allow you to serve several times more users, you should probably do it before figuring out how to scale horizontally.
Finally, and most importantly, look at a CPU profile of your application before embarking on any optimization effort. You need to know that the thing you want to optimize is actually taking CPU time, and your measurements can give you a lot of hints as to what can improve.
How Hardware Executes Instructions
Almost every CPU, from the smallest microcontrollers to the largest server CPUs, has a pipelined architecture. This means that in each of these CPUs, multiple instructions are in flight at any single time. Pipelining allows a CPU to raise its clock frequency without spending multiple clock cycles per instruction. Larger CPUs tend to have deeper pipelines: microcontroller cores usually have 2-5 cycle pipelines, application processors tend to have pipelines around 10 cycles long, and server CPUs are over 15 cycles long.
Additionally, CPUs larger than microcontroller cores will go a step further, and have logic to execute multiple instructions at the same time. Mobile processors tend to be able to execute 2-4 instructions per cycle, while desktop and server cores can execute up to 8 instructions in a single clock cycle (as of 2022).
The largest cores contain logic to re-order instructions. This allows you to issue instructions
whose arguments are not yet available without blocking the CPU. This is useful when you have
instructions with variable latency, such as memory loads with a cache hierarchy or instructions
like DIV which execute a basic operation that has no fast hardware implementation.
A modern server CPU has high-throughput pipeline, capable of working on hundreds of instructions at the same time, and churning through 4 or more per clock cycle. Because of the pipelined and out-of-order processing of instructions, there are a lot of tricks used to hide the true processing time of instructions from the programmer and make sure that you see a reasonable computing abstraction. Register renaming, complex instruction schedulers, branch predictors, and pipeline bypassing multiplexers are all parts of this.
Here is an AMD Zen 2 core, from WikiChip, showing off all of its major units:

In addition, due to the latency of memory, CPUs have complex cache hierarchies to ensure that most memory reads are completed quickly, while providing an "infinite memory" abstraction to programs with virtual memory. This system of caches and virtualization accelerators (called Translation Lookaside Buffers) are involved in memory reads and writes, and can introduce latency to both.
Parts of a CPU Core
Broadly speaking, CPU cores are split into three parts: the frontend, the backend, and the memory subsystem. The frontend is responsible for fetching and decoding instructions that need to be executed, and the backend does the execution. The memory subsystem handles interactions with the CPU's bus matrix, facilitating access to I/O controllers, chip-wide caches, and main memory. Each component interacts with the others at well-defined interface: the frontend passes CPU-specific commands called micro-ops to the backend, and both the frontend and backend issue memory accesses to the memory subsystem.
When you are micro-optimizing, most of your energy will be likely focused on the backend. The the frontend tends to establish limits on how fast you can go, and memory access problems have likely been fixed long before you start thinking about cycle-by-cycle performance. Nevertheless, functional units inside each part of the core can be the limiting factor.
For one final note about the parts of the CPU core: Most CPUs of a similar performance class have a similar architecture. An x86 server CPU will have more in common with an ARM (or even RISC-V) server CPU than it does with an embedded x86 CPU. Everything I will discuss below applies to desktop and server CPUs rather than embedded CPUs. Embedded CPUs are a lot easier to optimize for, since they contain many fewer parts.
Mental Models of Hardware Execution
Having a good mental model of how the CPU works helps you figure out how to get an understanding of the complexity of a modern CPU. In subsequent parts of this guide, we will be thinking about the different parts of the CPU core, and constructing a simple, useful mental model for its behavior. In particular, we would like the parts of the CPU to be modeled as reasonably tame directed graphs. Thankfully, CPU manufacturers have some help for us here: they make instruction retirement so wide that it is almost never the bottleneck.
This means that your mental model can usually consider only the forward flow of instructions through the pipeline, without worrying about feedback loops causing delay or odd performance pathologies. The one exception to this is branches, although the branch predictors on modern CPUs are very efficient at mitigating the performance impact of the dependency cycles that can come from branches.
In the subsequent parts of this guide, we are going to go in depth into the parts of a CPU to build mental models and intuition for how those components work.
The Frontend
Here is my overview of what happens in the frontend and how it attaches to the backend:
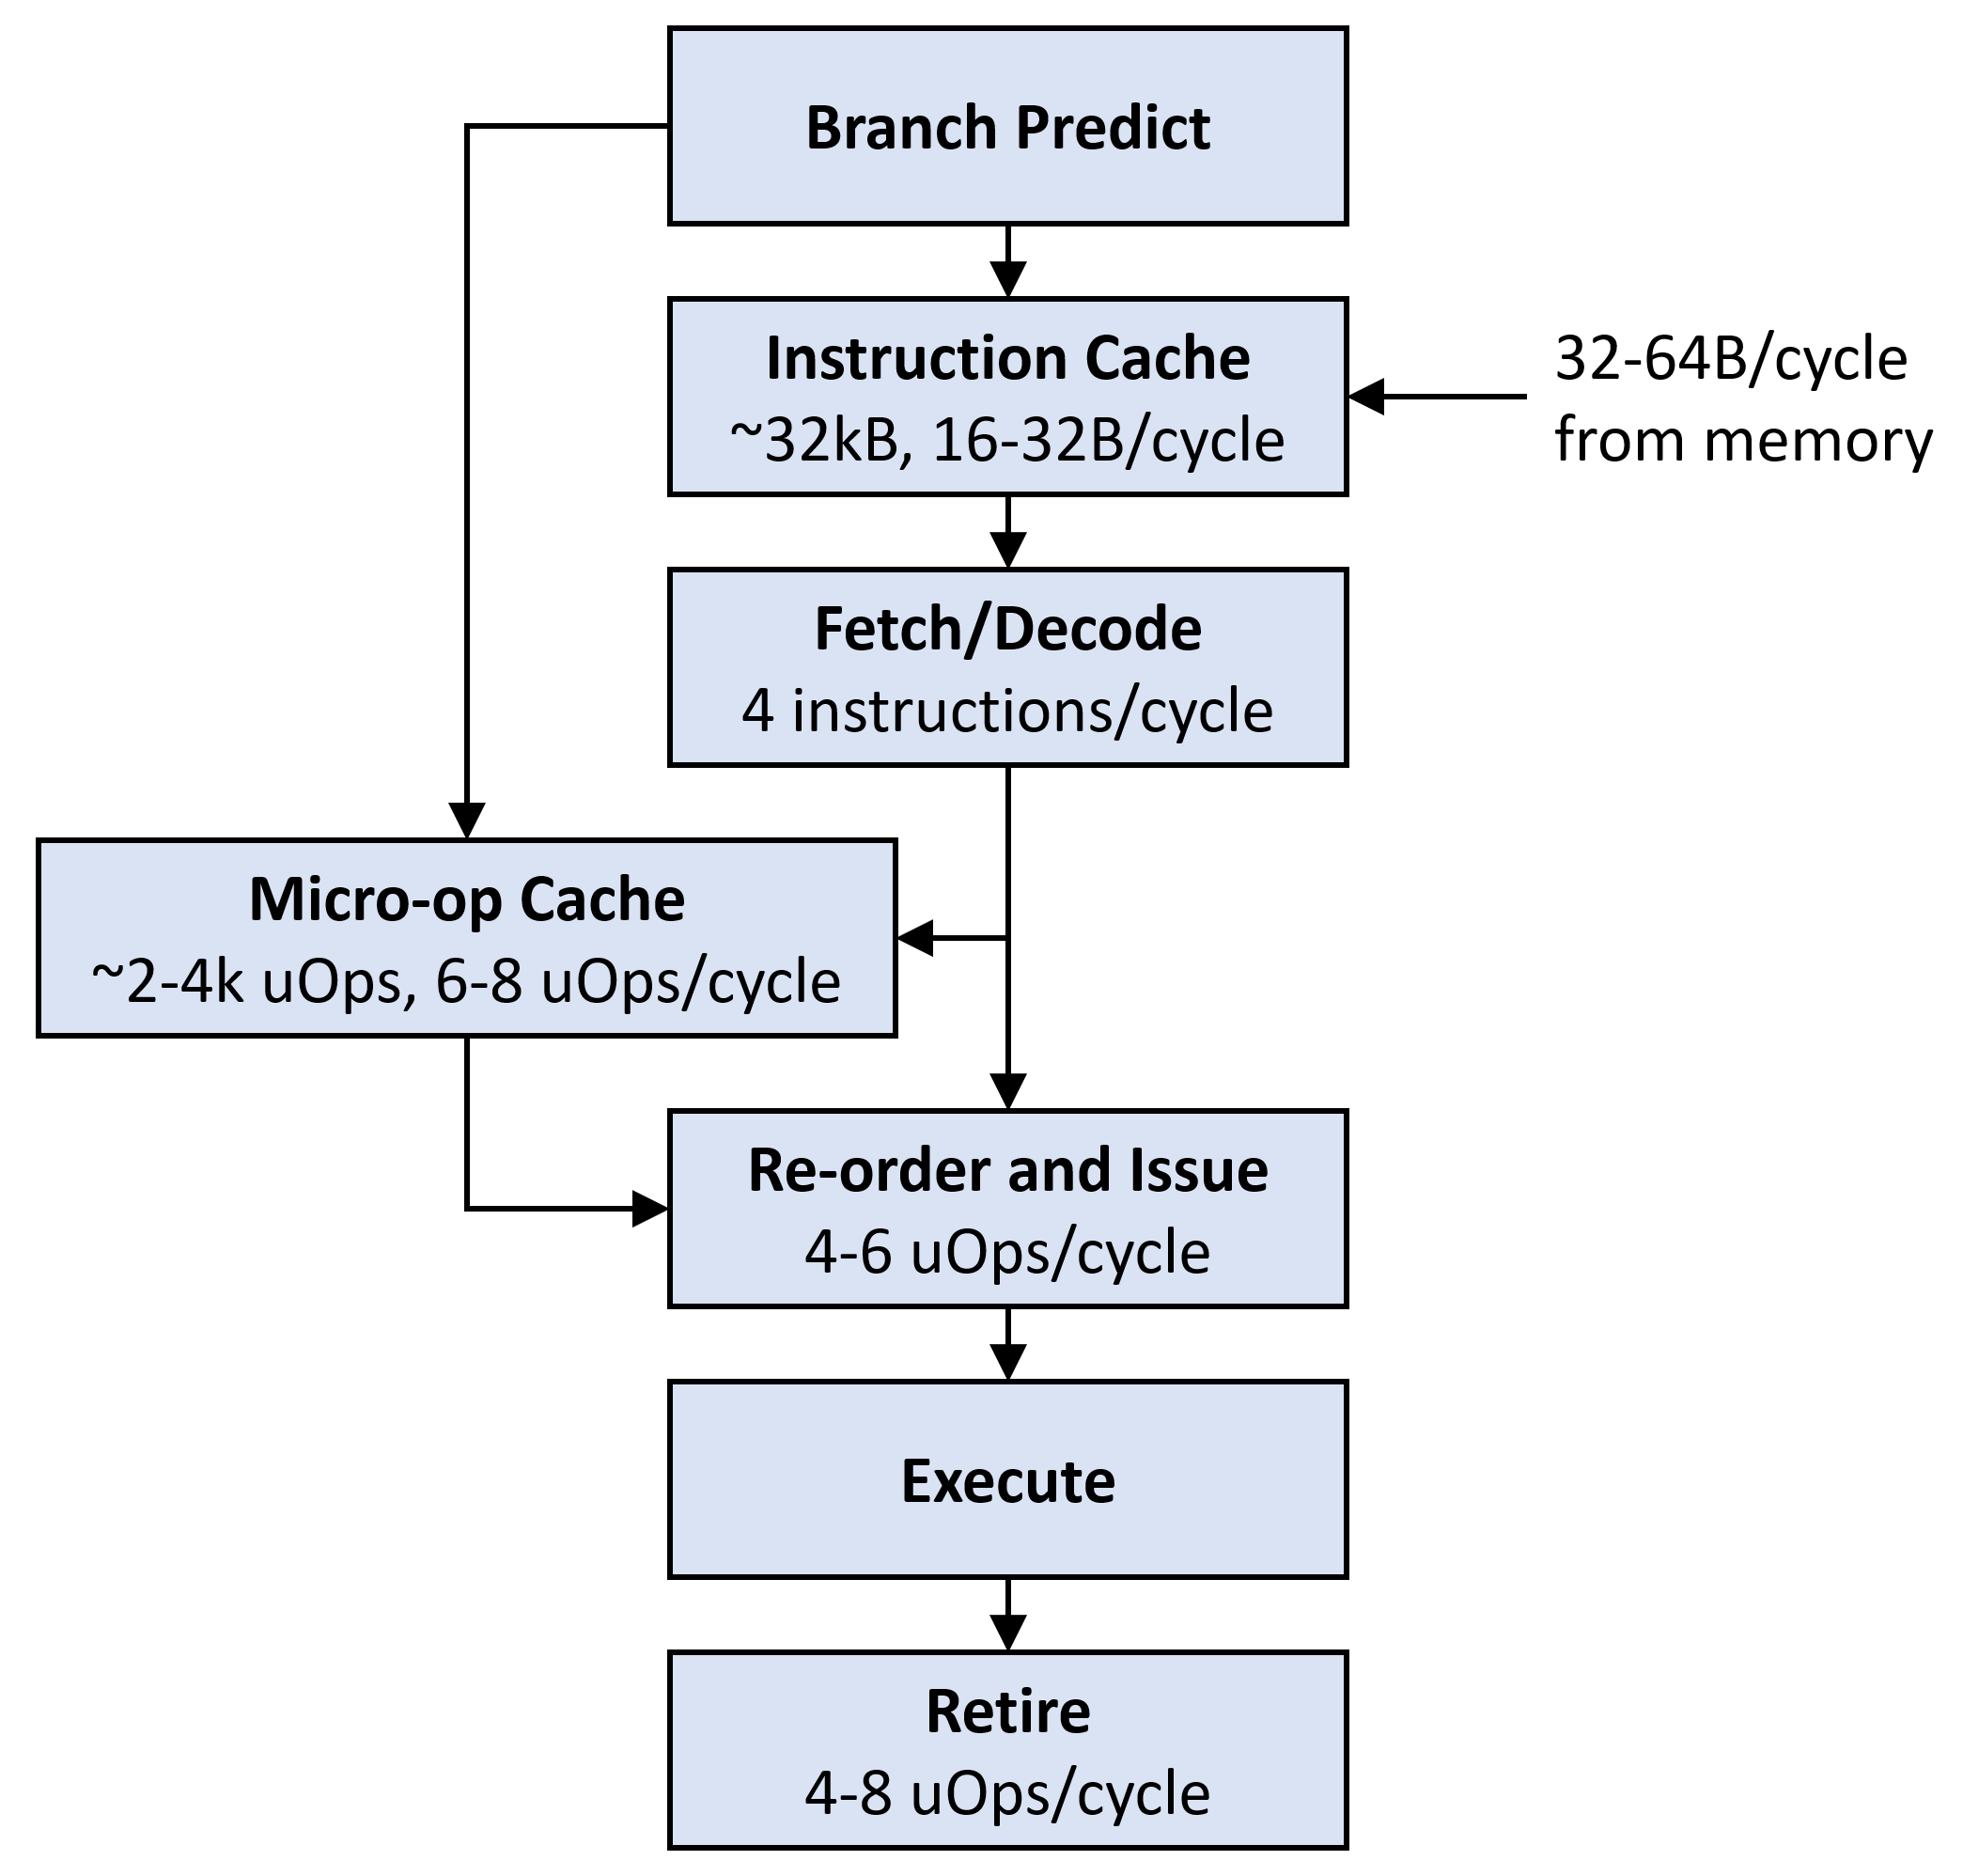
The frontend begins with the branch predictor, which determines the program counter value from which to fetch instructions. This is by far the largest piece of silicon inside the core, accounting for 25% or more of it. If you have a truly unpredictable branch, you will need to consider the impact of branch mispredictions: each misprediction requires the pipeline to drain before you can do useful work, costing around 15 cycles on a server CPU (about 60-100 instruction slots). Removing these unpredictable branches can improve code performance significantly. In most micro-optimization cases, however, you are working with a tight loop that runs many iterations (often a fixed number of iterations), and the branch predictor's behavior is nearly perfect.
The branch predictor emits an address to read from one of two caches: either the instruction cache or the micro-op cache. The micro-op cache, used for loops, contains a small number of decoded micro-ops that are ready to issue to the backend. If the address to fetch is not in the micro-op cache, ops are fetched from the instruction cache (or from further down the cache hierarchy if needed), and then decoded. At this stage, multiple instructions may also be fused together into one micro-op. Once the instruction is decoded into micro-ops, it is issued to the backend for execution, and eventually retired.
Re-ordering can happen at many parts inside the actual frontend, and we will go into more depth about when this happens, but we can consolidate the re-ordering step into the final issue step in our mental model for now, while assuming that the front-end does what it needs to do to keep itself and the backend saturated with usable instructions. This is usually almost true in practice.
The Backend
An example of a CPU backend, modeled after an Intel Skylake, is below:
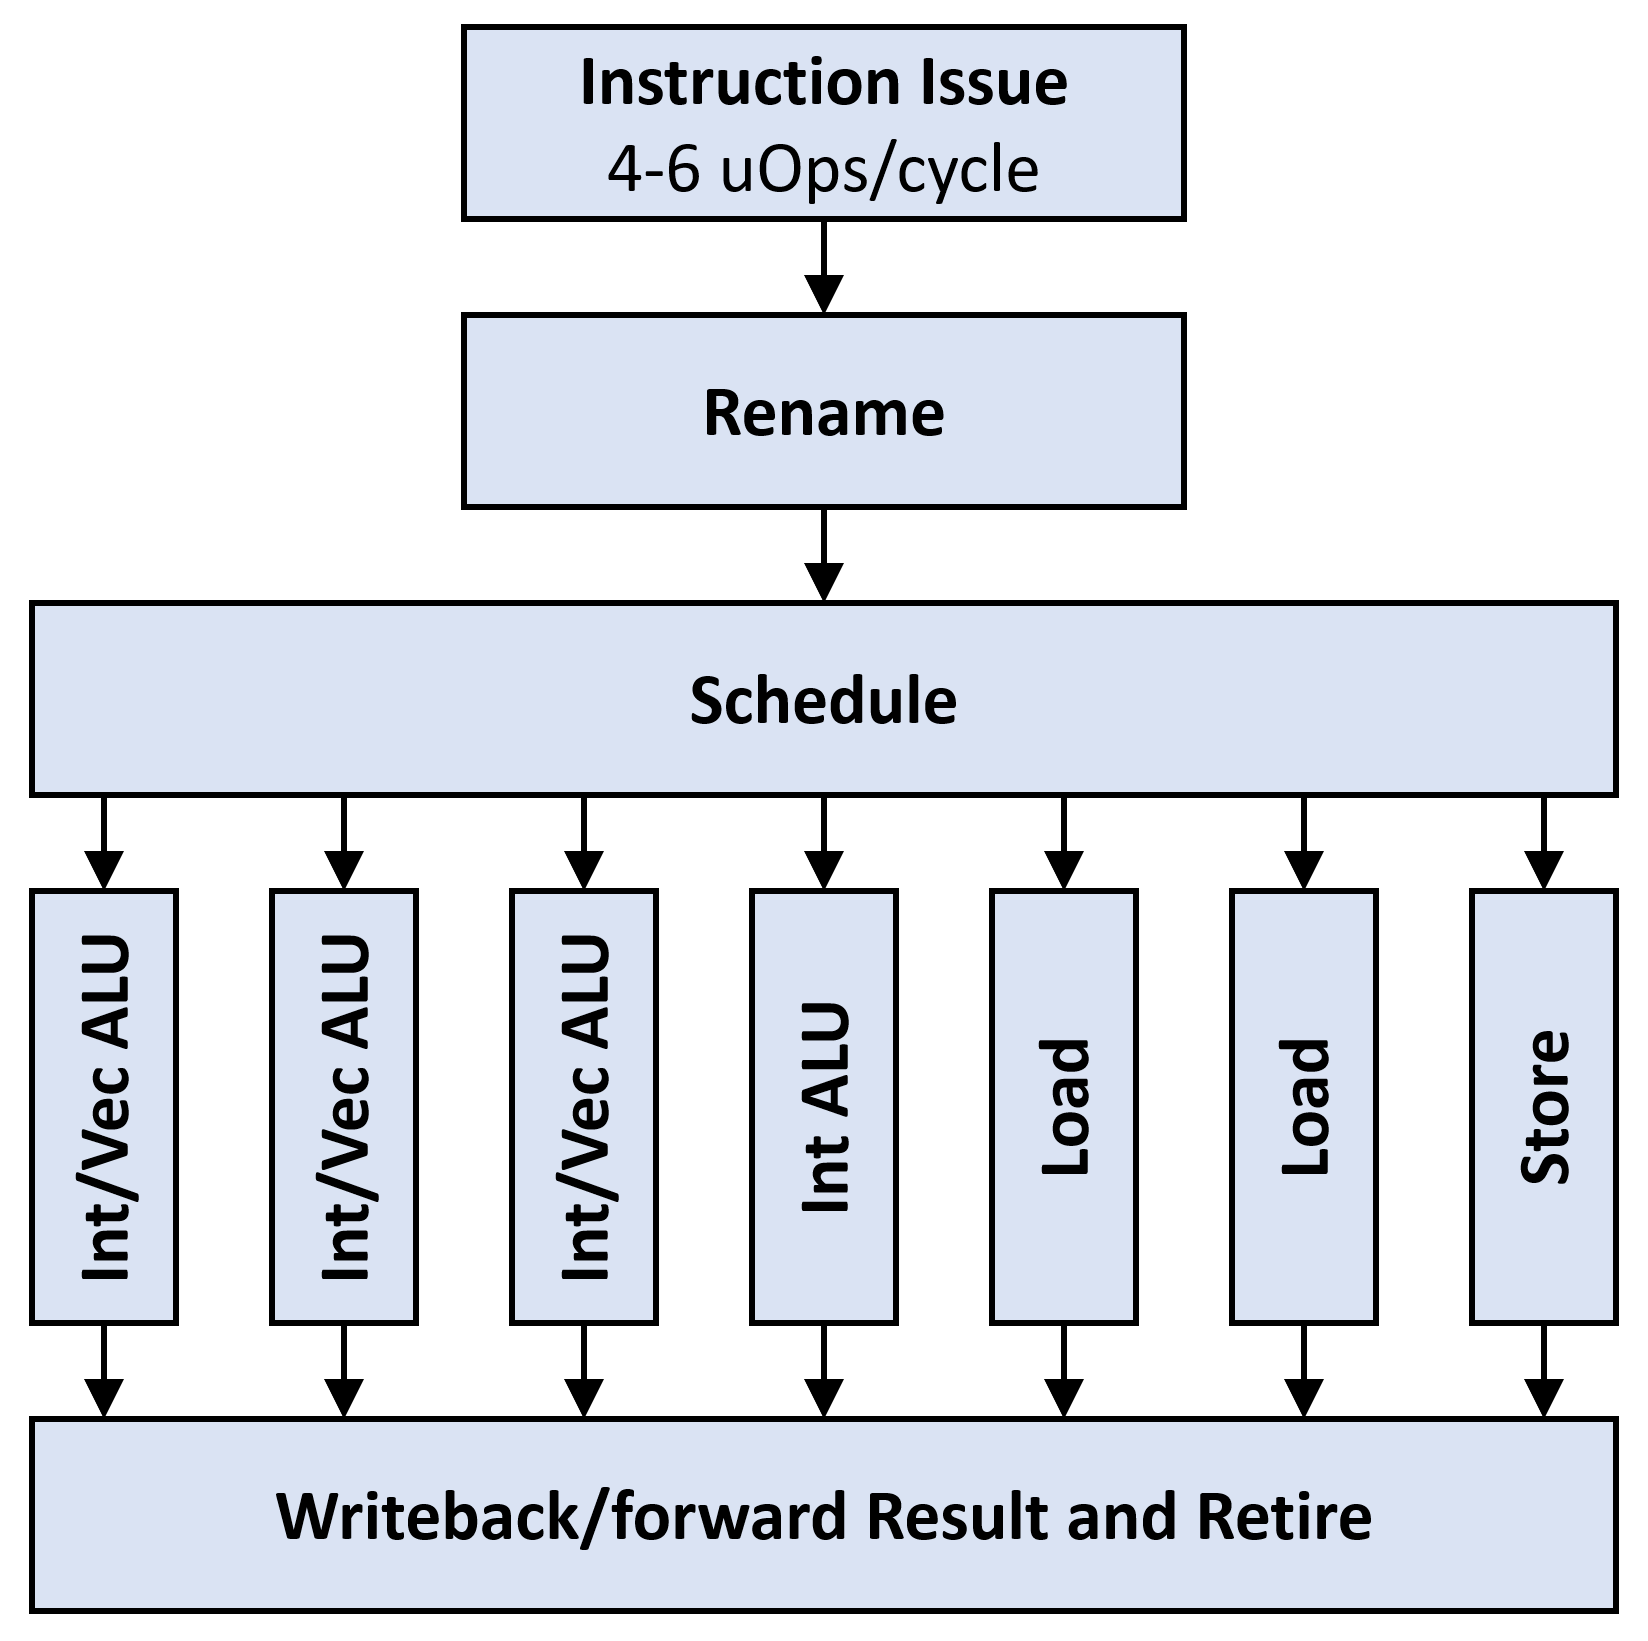
The backend has a comparatively simple job: it contains many execution units and uses them to execute micro-ops that it receives from the frontend. It uses several tricks baked into the renaming and scheduling steps to keep instructions flowing and keep the individual execution units full.
During the rename step, the backend re-names registers in the assembly code to make sure that there are no false dependencies. CPUs with 16 or 32 registers specified by their architecture often have over 150 physical registers, and will rename the architectural registers each time they are reassigned. The scheduler issues instructions to ports when their operands are ready. This way, long dependency chains of instructions can be kept out of the way of other instructions that do not depend on those results, and the units can be kept full.
The execution units themselves are a mixture of:
- Arithmetic/Logic Units (ALUs) for integer work, some of which can also execute branches
- ALUs for vector work
- Units for loading data from memory and storing data to memory
Each unit has specific micro-ops that it can accept, and each micro-op has specific latency and throughput. For example, micro-ops for addition usually have 1 cycle latency, while multiplication micro-ops have 3 cycle latency. Due to pipelining, both micro-ops still have throughput of 1 instruction per cycle, but some other micro-ops, such as the ones for memory barriers, have worse throughput. Many instructions can be satisfied by several different units, but some are restricted to one unit: for example, additions can generally be satisfied by any ALU, but instructions like CRC32C and even multiplications are more restricted.
After execution, the results from each pipeline are written back to registers or forwarded to other execution units for future use. Finally, the instruction is retired, advancing the state of the CPU. Due to the complexity of out-of-order operation, CPUs have a limited window of instructions that can actually be executed out of order, and the retire stage is the final point of serialization. Pretty much everything that happens between instruction fetch and retirement happens out of order.
CPU backends are one of the areas that has the most variation: the exact units used and their organization varies greatly between vendors. While a CPU frontend on one core may be wider or narrower in certain areas than another core, their backends may have very different compositions.
The Memory Subsystem
Here is a model for the units involved in how a CPU interacts with memory:
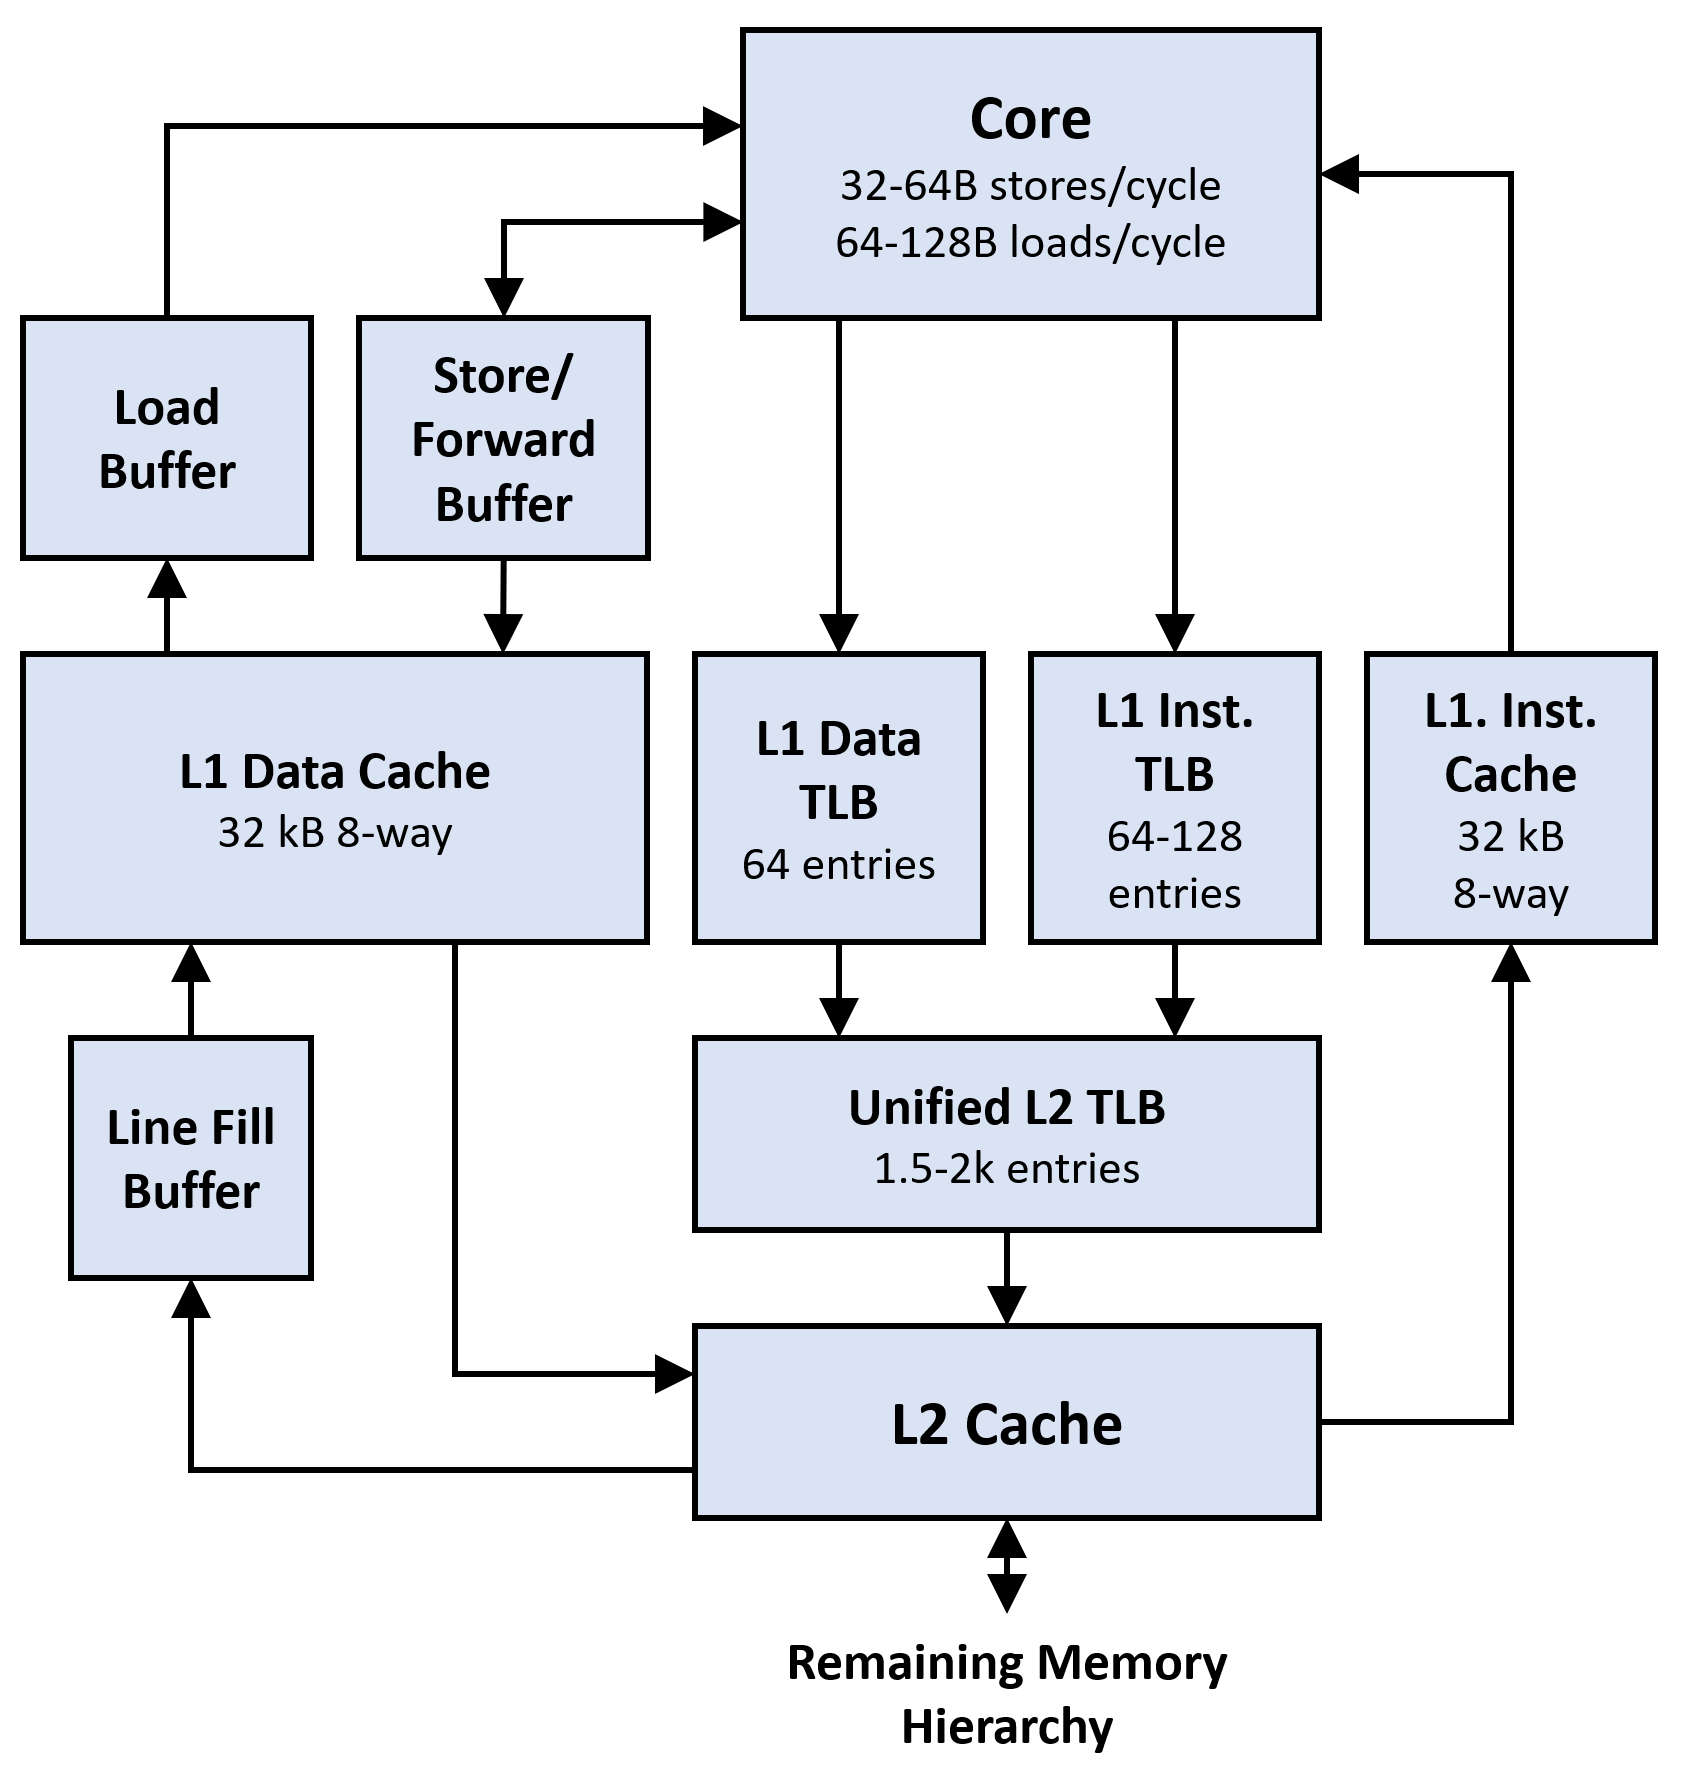
The memory subsystem is simultaneously the part of the core that is the most arcane and the most well-known to software engineers. The caches are the most important and well-known parts of the memory system. However, surrounding the caches, there are many buffers that handle out-of-order access to memory, allow writes and reads of partial cache lines to retire without fetching the full cache line, and allow the CPU to re-order memory accesses. Additionally, there are several translation lookaside buffers (TLBs) that are used to accelerate virtual memory accesses. Each of these buffers, caches, and TLBs accelerates a particular aspect of memory access, and each can be a bottleneck.
Finally, the diagram above addresses only the parts of the memory hierarchy that are attached to individual cores (or small groups of cores in some architectures). The remaining memory hierarchy contains many more complex features, including a bus matrix that can be locked to implement atomic operations; inter-socket cache coherency systems; and large, heterogeneous system-wide caches. These can all affect the performance of individual cores, but tend to fall outside the scope of "micro-optimization."
Micro-Optimization Tools
Starting out, you need to thoroughly measure the code that you are trying to optimize. There are many tools that can be used for this purpose depending on what you are trying to measure. However, some of the most useful ones for micro-optimization are purpose-built and specific.
Performance Counters
CPUs contain many performance counters that you can use to figure out what is happening inside a given core. These are vendor-specific and architecture-specific, but they often provide enough visibility to get a clue as to what functional units are bottlenecking a particular piece of code.
The usual tool for accessing performance counters is GNU perf, but vendor-specific tools, such
as Intel's vtune can also be used for this purpose. GPUs often also have performance counters
available, usually through vendor-specific tools.
Measurements of performance counters are usually your first clue as to why you need to micro-optimize a particular section of code, and they are used throughout the process to measure your progress.
Benchmarks
Micro-optimization makes heavy use of benchmarks, but benchmarks tend to have long iteration
cycles and often don't offer precise information about the nature of the code you are running.
This means that they are not always the first choice of tool for micro-optimization.
In order to provide visibility into the performance counters of a CPU which tell you about its
behavior, specialized microbenchmarking frameworks, such as Agner Fog's
TestP are very useful.
One cautionary note on benchmarks: they often over-estimate how fast your code runs, since they allow you to measure behavior when a piece of code has a monopoly on the resources of a machine. This has the potential to distort your results, which becomes particularly noticeable when caching effects are involved.
Microarchitectural Code Analyzers
Code analyzers such as Intel's (sadly deprecated) architecture code analyzer (IACA), as well as similar tools from LLVM and uops.info, are among the most useful tools for micro-optimization. These tools provide you the most precise observability into your code's execution by simulating how it runs on a core. They use detailed knowledge of the microarchitecture of a CPU to determine how a CPU should execute your code, and show you when and how instructions are scheduled and executed.
Code analyzers are usually moderately wrong about the performance of your code - moreso than benchmarks - but they are very good at pinpointing the factors that bottleneck execution. In some cases, a simplifying assumption in the analyzer can cause major differences between the analyzer's predicted performance and your actual performance. However, in exchange for being slightly wrong, they provide unparalleled visibility into the likely problems with your code.
Microarchitectural analyzers are best used in tandem with a benchmark: the benchmark will allow you to test hypotheses about your code's performance and improvements you make.
These analyzers give you nearly complete visibility into how your code runs, and have the fastest iteration cycle of all of the tools listed here. For this reason, I spend the most time using code analyzers when micro-optimizing, but keep benchmarks ready to test the accuracy of the analyzer's predictions.
Conclusions
Micro-optimization is the application of computer architecture to software performance. By thinking about the architecture of the CPU and modeling how it runs our code, we can understand how to make the hardware sing, and pull the last few drops of speed out of the system.
Finally, by going into our code's performance to this level of depth, and thinking about how to make code run extremely fast, we can gain insight into how to make ordinary code run well, and how to understand system performance more generally.
I am planning to go into much more depth on each part of the core and the tools and processes to optimize them in later parts, starting with the backend in part 2.